Research Methods
Christopher Klein

RESEARCH METHODS IN PSYCHOLOGY
One of the important steps in scientific inquiry is to test our research questions, otherwise known as hypotheses. However, there are many ways to test hypotheses in psychological research. Which method you choose will depend on the type of questions you are asking, as well as what resources are available to you. All methods have limitations, which is why the best research uses a variety of methods. Most psychological research can be divided into two types: experimental and correlational research.

EXPERIMENTAL RESEARCH
Imagine you are taking notes in class. Should you take typed notes on your laptop, or longhand notes in a notebook? Which method of note taking will help you learn the most from lecture? As long as you’re taking notes, does it really matter?
Pam A Mueller and Daniel M. Oppenheimer, psychology researchers at Princeton University and UCLA, set out to test the difference between longhand and laptop note taking (Mueller & Oppenheimer, 2014). Participants in their experiment were told to take notes while they watched video lectures. Half of the participants were given a notebook to take notes, meaning they would take notes longhand, and the other half were given a laptop for note taking, meaning they would type their notes. Afterward, participants completed a test that measured how much participants learned from the lectures.
In an experiment, researchers manipulate, or cause changes, in the independent variable, and observe or measure any impact of those changes in the dependent variable. The independent variable is the one under the experimenter’s control, or the variable that is intentionally altered between groups. In the case of Mueller and Oppenheimer’s experiment, the independent variable was whether participants took notes longhand or using a laptop. The dependent variable is the variable that is not manipulated at all, or the one where the effect happens. One way to help remember this is that the dependent variable “depends” on what happens to the independent variable. In our example, the participants’ learning (the dependent variable in this experiment) depends on how the participants take notes (the independent variable). Thus, any observed changes or group differences in learning can be attributed to note taking method. What Mueller and Oppenheimer found was that the people who took notes longhand learned significantly more from the lectures than those who took notes using a laptop. In other words, the note taking method students use causes a difference in learning. Do you find this surprising?
But wait! Doesn’t learning depend on a lot of different factors—for instance, how intelligent someone is, or how much they already know about a topic? How can we accurately conclude that the note taking method causes differences in learning, as in the case of Mueller and Oppenheimer’s experiment? While the sample of participants was drawn from a population where everyone had an equal chance of being selected (also known as random selection), the most important thing about experiments is random assignment. That is, participants don’t get to pick which condition they are in (e.g., participants didn’t choose whether they took notes using a laptop or notebook). The experimenter assigns them to a particular condition based on the flip of a coin or the roll of a die or any other random method. Why do researchers do this? Random assignment makes it so the groups, on average, are similar on all characteristics except what the experimenter manipulates.
By randomly assigning people to conditions (laptop versus longhand note taking), some people who already have some knowledge about the lecture topics should end up in each condition. Likewise, some people who have never heard of the lecture topics should end up in each condition. As a result, the distribution of all these factors will generally be consistent across the two groups, and this means that on average the two groups will be relatively equivalent on all these factors. Random assignment is critical to experimentation because if the only difference between the two groups is the independent variable, we can infer that the independent variable is the cause of any observable difference (e.g., in the amount they learn from the lecture).
So why do people learn more from a lecture when they take longhand rather than laptop notes? It turns out that when people take notes on a laptop, they tend to take verbatim notes, meaning that they try to type every single word the lecturer says. On the other hand, when people take longhand notes, they tend to take summary notes, meaning that they reframe the ideas in their own words. This additional cognitive processing improves learning.
OTHER CONSIDERATIONS
In addition to using random assignment, you should avoid introducing confounds into your experiments. Confounds are things that could undermine your ability to draw causal inferences. For example, if you wanted to test if a new happy pill will make people happier, you could randomly assign participants to take the happy pill or not (the independent variable) and compare these two groups on their self-reported happiness (the dependent variable). However, if some participants know they are getting the happy pill, they might develop expectations that influence their self-reported happiness. This is sometimes known as a placebo effect. Sometimes a person just knowing that he or she is receiving special treatment or something new is enough to actually cause changes in behavior or perception: In other words, even if the participants in the happy pill condition were to report being happier, we wouldn’t know if the pill was actually making them happier or if it was the placebo effect
—an example of a confound. A related idea is participant demand. This occurs when participants try to behave in a way they think the experimenter wants them to behave. Placebo effects and participant demand often occur unintentionally. Even experimenter expectations can influence the outcome of a study. For example, if the experimenter knows who took the happy pill and who did not, and the dependent variable is the experimenter’s observations of people’s happiness, then the experimenter might perceive improvements in the happy pill group that are not really there.
One way to prevent these confounds from affecting the results of a study is to use a double- blind procedure. In a double-blind procedure, neither the participant nor the experimenter knows which condition the participant is in. For example, when participants are given the happy pill or the fake pill, they don’t know which one they are receiving. This way the participants shouldn’t experience the placebo effect, and will be unable to behave as the researcher expects (participant demand). Likewise, the researcher doesn’t know which pill each participant is taking (at least in the beginning—later, the researcher will get the results for data-analysis purposes), which means the researcher’s expectations can’t influence his or her observations. Therefore, because both parties are “blind” to the condition, neither will be able to behave in a way that introduces a confound. At the end of the day, the only difference between groups will be which pills the participants received, allowing the researcher to determine if the happy pill actually caused people to be happier.
CORRELATIONAL DESIGNS
When scientists passively observe and measure phenomena it is called correlational research. Here, we do not intervene and change behavior, as we do in experiments. In correlational research, we identify patterns of relationships, but we usually cannot infer what causes what.
So, what if you wanted to test whether spending on others is related to happiness, but you don’t have $20 to give to each participant? You could use a correlational design—which is exactly what Elizabeth Dunn, a professor at the University of British Columbia, did in a study (2008). She asked people how much of their income they spent on others or donated to charity, and later she asked them how happy they were. Do you think these two variables were related? Yes, they were! The more money people reported spending on others, the happier they were.

Image: https://hbr.org/2020/09/does-more-money-really-makes-us-more-happy
MORE DETAILS ABOUT THE CORREL ATION
To find out how well two variables correspond, we can plot the relation between the two scores on what is known as a scatterplot (Figure 1). In the scatterplot, each dot represents a data point. (In this case it’s individuals, but it could be some other unit.) Importantly, each dot provides us with two pieces of information—in this case, information about how good the person rated the past month (x-axis) and how happy the person felt in the past month (y-axis).
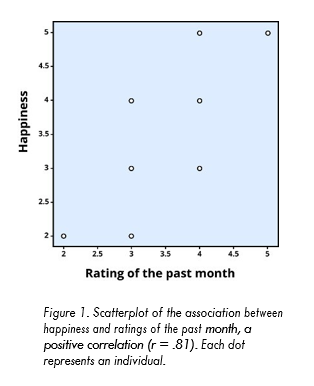
Figure 1. Scatterplot of the association between happiness and ratings of the past month, a positive correlation (r = .81). Each dot represents an individual.
Which variable is plotted on which axis does not matter. The association between two variables can be summarized statistically using the correlation coefficient (abbreviated as r). A correlation coefficient provides information about the direction and strength of the association between two variables. For the example above, the direction of the association is positive. This means that people who perceived the past month as being good reported feeling more happy, whereas people who perceived the month as being bad reported feeling less happy.
With a positive correlation, the two variables go up or down together. In a scatterplot, the dots form a pattern that extends from the bottom left to the upper right (just as they do in Figure 1). The r value for a positive correlation is indicated by a positive number (although, the positive sign is usually omitted). Here, the r value is .81. A negative correlation is one in which the two variables move in opposite directions. That is, as one variable goes up, the other goes down. Figure 2 shows the association between the average height of males in a country (y-axis) and the pathogen prevalence (or commonness of disease; x-axis) of that country. In this scatterplot, each dot represents a country. Notice how the dots extend from the top left to the bottom right. What does this mean in real-world terms? It means that people are shorter in parts of the world where there is more disease. The r value for a negative correlation is indicated by a negative number—that is, it has a minus (–) sign in front of it. Here, it is –.83.
The strength of a correlation has to do with how well the two variables align. Recall that in Professor Dunn’s correlational study, spending on others positively correlated with happiness: The more money people reported spending on others, the happier they reported to be. At this point you may be thinking to yourself, I know a very generous person who gave away lots of money to other people but is miserable! Or maybe you know of a very stingy person who is happy as can be. Yes, there might be exceptions. If an association has many exceptions, it is considered a weak correlation. If an association has few or no exceptions, it is considered a strong correlation. A strong correlation is one in which the two variables always, or almost always, go together. In the example of happiness and how good the month has been, the association is strong. The stronger a correlation is, the tighter the dots in the scatterplot will be arranged along a sloped line.
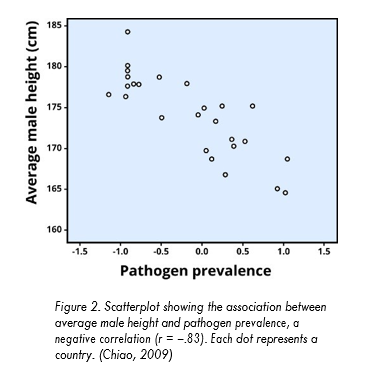
Figure 2. Scatterplot showing the association between average male height and pathogen prevalence, a negative correlation (r = –.83). Each dot represents a country. (Chiao, 2009)
PROBLEMS WITH THE CORRELATION
If generosity and happiness are positively correlated, should we conclude that being generous causes happiness? Similarly, if height and pathogen prevalence are negatively correlated, should we conclude that disease causes shortness? From a correlation alone, we can’t be certain. For example, in the first case it may be that happiness causes generosity, or that generosity causes happiness. Or, a third variable might cause both happiness and generosity, creating the illusion of a direct link between the two. For example, wealth could be the third variable that causes both greater happiness and greater generosity. This is why correlation does not mean causation—an often-repeated phrase among psychologists.
QUALITATIVE DESIGNS
Just as correlational research allows us to study topics we can’t experimentally manipulate (e.g., whether you have a large or small income), there are other types of research designs that allow us to investigate these harder-to-study topics. Qualitative designs, including participant observation, case studies, and narrative analysis are examples of such methodologies.
QUASI-EXPERIMENTAL DESIGNS
What if you want to study the effects of marriage on a variable? For example, does marriage make people happier? Can you randomly assign some people to get married and others to remain single? Of course not. So how can you study these important variables? You can use a quasi- experimental design.
A quasi-experimental design is similar to experimental research, except that random assignment to conditions is not used. Instead, we rely on existing group memberships (e.g., married vs. single). We treat these as the independent variables, even though we don’t assign people to the conditions and don’t manipulate the variables. As a result, with quasi-experimental designs causal inference is more difficult. For example, married people might differ on a variety of characteristics from unmarried people. If we find that married participants are happier than single participants, it will be hard to say that marriage causes happiness, because the people who got married might have already been happier than the people who have remained single.
LONGITUDINAL STUDIES
Another powerful research design is the longitudinal study. Longitudinal studies track the same people over time. Some longitudinal studies last a few weeks, some a few months, some a year or more. Some studies that have contributed a lot to psychology followed the same people over decades. For example, one study followed more than 20,000 Germans for two decades. From these longitudinal data, psychologist Rich Lucas (2003) was able to determine that people who end up getting married indeed start off a bit happier than their peers who never marry. Longitudinal studies like this provide valuable evidence for testing many theories in psychology, but they can be quite costly to conduct, especially if they follow many people for many years.
TRADEOFFS IN RESEARCH
Even though there are serious limitations to correlational and quasi-experimental research, they are not poor cousins to experiments and longitudinal designs. In addition to selecting a method that is appropriate to the question, many practical concerns may influence the decision to use one method over another. One of these factors is simply resource availability— how much time and money do you have to invest in the research? (Tip: If you’re doing a senior honor’s thesis, do not embark on a lengthy longitudinal study unless you are prepared to delay graduation!) Often, we survey people even though it would be more precise—but much more difficult—to track them longitudinally. Especially in the case of exploratory research, it may make sense to opt for a cheaper and faster method first. Then, if results from the initial study are promising, the researcher can follow up with a more intensive method.
Beyond these practical concerns, another consideration in selecting a research design is the ethics of the study. For example, in cases of brain injury or other neurological abnormalities, it would be unethical for researchers to inflict these impairments on healthy participants. Nonetheless, studying people with these injuries can provide great insight into human psychology (e.g., if we learn that damage to a particular region of the brain interferes with emotions, we may be able to develop treatments for emotional irregularities). In addition to brain injuries, there are numerous other areas of research that could be useful in understanding the human mind but which pose challenges to a true experimental design— such as the experiences of war, long-term isolation, abusive parenting, or prolonged drug use. However, none of these are conditions we could ethically experimentally manipulate and randomly assign people to. Therefore, ethical considerations are another crucial factor in determining an appropriate research design.
RESEARCH METHODS: WHY YOU NEED THEM
Just look at any major news outlet and you’ll find research routinely being reported. Sometimes the journalist understands the research methodology, sometimes not (e.g., correlational evidence is often incorrectly represented as causal evidence). Often, the media are quick to draw a conclusion for you. After reading this module, you should recognize that the strength of a scientific finding lies in the strength of its methodology. Therefore, in order to be a savvy consumer of research, you need to understand the pros and cons of different methods and the distinctions among them. Plus, understanding how psychologists systematically go about answering research questions will help you to solve problems in other domains, both personal and professional, not just in psychology.
REFERENCES
__________________________________________________________________________________________________________________________________________________________________________
Benjamin, L. T. (2007). A brief history of modern psychology. Malden, MA: Blackwell Publishing.
Benjamin, L. T. (2000). The psychology laboratory at the turn of the 20th century. American Psychologist, 55, 318– 321.
Benjamin, L. T., & Baker, D. B. (2004). From séance to science: A history of the profession of psychology in America. Belmont, CA: Wadsworth/Thomson Learning.
Cautin, R., & Baker, D. B. (in press). A history of education and training in professional psychology. In B. Johnson & N. Kaslow (Eds.), Oxford handbook of education and training in professional psychology. New York, NY: Oxford University Press.
Chiao, J. (2009). Culture–gene coevolution of individualism – collectivism and the serotonin transporter gene. Proceedings of the Royal Society B, 277, 529-537. doi: 10.1098/rspb.2009.1650
Dunn, E. W., Aknin, L. B., & Norton, M. I. (2008). Spending money on others promotes happiness. Science, 319(5870), 1687–1688. doi:10.1126/science.1150952
Evans, R. B. (1972). E. B. Titchener and his lost system. Journal of the History of the Behavioral Sciences, 8, 168–180.
Fancher, R. E. (1987). The intelligence men: Makers of the IQ controversy. New York, NY: W.W. Norton & Company.
Fancher, R. E., & Rutherford, A. (2011). Pioneers of psychology: A history (4th ed.). New York, NY: W.W. Norton & Company.
Festinger, L., Riecken, H.W., & Schachter, S. (1956). When prophecy fails. Minneapolis, MN: University of Minnesota Press.
Fuchs, A. H. (2000). Contributions of American mental philosophers to psychology in the United States. History of Psychology, 3, 3–19.
Garnets, L., & Kimmel, D. C. (2003). What a light it shed: The life of Evelyn Hooker. In L. Garnets & D. C. Kimmel (Eds.), Psychological perspectives on gay, lesbian, and bisexual experiences (2nd ed., pp. 31–49). New York, NY: Columbia University Press.
Goodwin, C. J. (2011). A history of modern psychology (4th ed.). Hoboken, NJ: Wiley.
Goodwin, C. J. (1985). On the origins of Titchener’s experimentalists. Journal of the History of the Behavioral Sciences, 21, 383–389.
Guthrie, R. V. (2003). Even the rat was white: A historical view of psychology (2nd ed.). Boston, MA: Allyn & Bacon.
Harker, L. A., & Keltner, D. (2001). Expressions of positive emotion in women’s college yearbook pictures and their relationship to personality and life outcomes across adulthood. Journal of Personality and Social Psychology, 80, 112–124.
King, L. A., & Napa, C. K. (1998). What makes a life good? Journal of Personality and Social Psychology, 75, 156–165.
Leahey, T. H. (2012). A history of psychology: From antiquity to modernity (7th ed.). Upper Saddle River, NJ: Pearson Education.
Lucas, R. E., Clark, A. E., Georgellis, Y., & Diener, E. (2003). Re-examining adaptation and the setpoint model of happiness: Reactions to changes in marital status. Journal of Personality and Social Psychology, 84, 527–539.
Mueller, P. A., & Oppenheimer, D. M. (2014). The pen is mightier than the keyboard: Advantages of longhand over laptop note taking. Psychological Science, 25(6), 1159-1168.
Scarborough, E. & Furumoto, L. (1987). The untold lives: The first generation of American women psychologists. New York, NY: Columbia University Press.
Shultz, D. P., & Schultz, S. E. (2007). A history of modern psychology (9th ed.). Stanford, CT: Cengage Learning. Sokal, M. M. (1980). Science and James McKeen Cattell. Science, 209, 43–52.
Titchener, E. B. (1909). A text-book of psychology. New York, NY: Macmillan.
Wertheimer, M. (1938). Gestalt theory. In W. D. Ellis (Ed.), A source book of Gestalt psychology (1-11). New York, NY: Harcourt.
CHAPTER 1 LICENSE & ATTRIBUTION
Rise of Cognitive Psychology
Source: Baker, D. B. & Sperry, H. (2019). History of psychology. In R. Biswas-Diener & E. Diener (Eds), Noba textbook series:
Psychology. Champaign, IL: DEF publishers. Retrieved from http:// noba.to/j8xkgcz5
History of Psychology by David B. Baker and Heather Sperry is licensed under a Creative Commons Attribution-NonCommercial-ShareAlike 4.0 International License.
Condensed from original Research Methods in Psychology
Source: Scollon, C. N. (2019). Research designs. In R. Biswas-Diener &
- Diener (Eds), Noba textbook series: Psychology. Champaign, IL: DEF publishers. Retrieved from http://noba.to/acxb2thy
Research Designs by Christie Napa Scollon is licensed under a Creative Commons Attribution-NonCommercial-ShareAlike 4.0 International License
Condensed from original; Example experiment under “Experimental research” changed to Mueller and Oppenheimer (2014)
Cover photo by Jean-Marc Côté, Wikimedia Commons.
Media Attributions
- klein_15
- klein_21
