2-6: Statistics
 Statistics are facts and figures that condense large quantities of information into meaningful summaries. Understanding statistical concepts helps you design better studies, choose appropriate analyses, and interpret results accurately while avoiding common mistakes.
There are several types of statistics that serve different purposes:
Descriptive Statistics
- Measures of Central Tendency
- Measures of Dispersion
- Correlation and Regression
Inferential Statistics (also called hypothesis testing procedures)
- t-tests, ANOVAs, and other significance tests
Meta-Analysis
- Methods for combining results across multiple studies
Descriptive Statistics: Measures of Central Tendency
Measures of central tendency identify the single best score to describe an entire sample of scores:
Mode: The most frequent score in a distribution. This is best for categorical data where you want to know the most common response.
Median: The score in the middle of a distribution when all scores are arranged in order. This is best when some numbers are outliers that would distort the mean.
Mean: The arithmetic average of a group of scores. This is the most useful and common measure for most statistical purposes.
Descriptive Statistics: Measures of Dispersion
Measures of dispersion tell you how closely scores in a sample are grouped around the mean — they describe the “spreadoutedness” of your data:
Range: The spread of scores from low to high. This gives you a quick sense of the total variability but can be heavily influenced by extreme outliers.
Variance: A more useful measure of dispersion than the range because it incorporates information from all scores rather than just the extremes.
Standard deviation: The square root of variance, which retains the original metric of the scores. This is the most commonly used measure of variability.
Shapes of Distributions
Normal distribution: Depicted by the familiar bell-shaped curve where most scores are around the mean with fewer at the extremes of the distribution. Lots of human qualities and characteristics are distributed normally — performance, intelligence, height, and many personality traits.
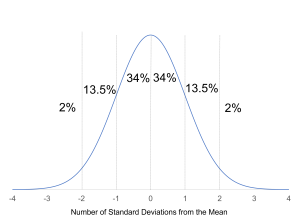
The normal distribution is incredibly useful because it allows you to:
- Calculate percentile scores — determine where a person ranks compared to the population
- Make probability statements about the likelihood of obtaining certain scores
- Apply many statistical tests that assume normality
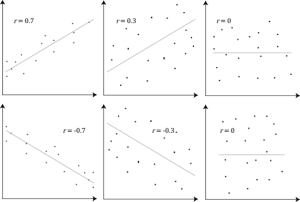
Descriptive Statistics: Correlation
Correlation coefficient: An index of the strength of relationship between two variables, represented by “r” and ranging from -1.00 to +1.00.
Direction: Correlations can be positive (both variables increase together, like an elevator) or negative (as one increases the other decreases, like a teeter-totter).
Magnitude: The absolute value tells you relationship strength, ranging from 0 (no relationship) to +/- 1.00 (perfect relationship).
Remember: correlation never implies causation! Just because two variables are related doesn’t mean one causes the other.
Regression
Regression allows you to predict one variable from another. You “regress the DV on the IV!” The correlation coefficient in this context becomes a validity coefficient — just an “r” that tells you how well you can predict the criterion from the predictor.
Coefficient of determination (r²) tells you the percentage of variance in the criterion accounted for by the predictor. If the correlation between a test and job performance is .50, then r² = .25, meaning the test explains 25% of the variance in performance.
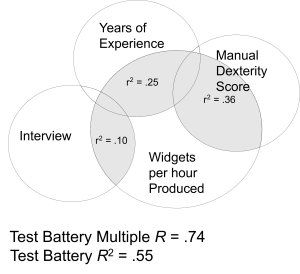
Simple regression uses one predictor, while multiple regression uses several predictors simultaneously in a selection battery, often improving prediction accuracy compared to using predictors individually.
Inferential Statistics (Hypothesis Testing Procedures)
Inferential statistics are statistical procedures that allow us to “infer” unknown things about populations based on sample data. For instance, if you have a new training procedure, you use inferential statistics to decide whether it led to higher productivity compared to the old method.
There are many types of inferential tests depending on the situation. t-tests and ANOVAs are the most common, used to compare means between groups.
When making decisions with inferential statistics, errors are bound to happen because we’re making inferences about populations based on limited sample data.
 Errors in Decision-Making
Type I Error: Incorrectly rejecting a true null hypothesis — concluding that an effect exists when it really doesn’t. This is like convicting an innocent person.
Type II Error: Incorrectly accepting a false null hypothesis — missing a real effect that actually exists. This is like letting a guilty person go free.
Statistical significance levels (like α = .05) represent the probability of making Type I errors. When you set alpha at .05, you’re saying you’re willing to accept a 5% chance of incorrectly concluding that an effect exists.
There’s a tradeoff between these error types — reducing one tends to increase the other.
Meta-Analysis
Meta-analysis is a methodology used to do quantitative literature reviews. Instead of traditional simple narrative reviews that just describe what different studies found, meta-analysis combines the empirical findings from multiple studies to quantify the relationship between two variables across an entire research literature.
Meta-analysis provides more robust conclusions than individual studies by:
- Combining results across many studies and participants
- Identifying factors that influence relationship strength
- Providing more precise estimates of effect sizes
- Revealing patterns that might not be apparent in individual studies
Meta-analyses have become the gold standard for evidence-based practice because they provide the most comprehensive and reliable evidence about what interventions actually work in organizational settings.
This quantitative approach to literature review has revolutionized how we understand research findings and make evidence-based decisions in I/O psychology.
Advanced Quantitative Techniques in I/O Psychology
In addition to traditional statistical methods, modern I/O psychology increasingly relies on advanced quantitative techniques to analyze complex organizational phenomena. These methods allow researchers to uncover deeper insights and account for multiple levels of influence within organizations.
Structural Equation Modeling (SEM) is a powerful technique that enables researchers to test complex relationships between observed and latent variables. For example, SEM can be used to examine how leadership style influences employee engagement through mediating variables like trust and communication. By modeling these indirect effects, SEM provides a more nuanced understanding of organizational dynamics.
Hierarchical Linear Modeling (HLM), also known as multilevel modeling, is essential when data are nested–such as employees within teams or departments. HLM allows researchers to analyze how variables at different levels (e.g., individual, team, organizational) interact. For instance, HLM can assess how team-level leadership affects individual job satisfaction while accounting for individual differences.
Generalizability Theory extends classical test theory by examining multiple sources of measurement error. It helps researchers determine how reliable a measure is across different conditions, such as time, raters, or items. In I/O psychology, generalizability theory is used to evaluate the consistency of performance ratings across different supervisors and contexts.
These advanced techniques are crucial for addressing the complexity of modern organizational research. They enable I/O psychologists to develop more accurate models, improve measurement precision, and generate findings that are both scientifically robust and practically relevant.
Media Attributions
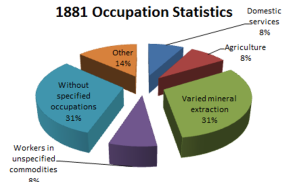
- 1881 Occupation Statistics © OllieDearing is licensed under a CC BY (Attribution) license
- Normal Distribution © Jay Brown
- Correlations © Laerd Statistics is licensed under a CC BY-SA (Attribution ShareAlike) license
- Selection Battery © Jay Brown
- Statistically Speaking © Jay Brown and Copilot