7-2: Performance Appraisal Part 1: Rating Formats
 Performance appraisal involves systematic review and evaluation of job performance and feedback delivery. Think of it as the “how” of measuring performance—the actual tools and techniques organizations use to figure out how well people are doing their jobs.
Organizations employ various tools, each with distinct advantages and limitations, serving three primary purposes: personnel decisions (promotions or terminations), developmental purposes (identifying strengths and weaknesses for coaching), and documentation (legal defense against potential lawsuits). It’s like having different tools in a toolbox—each one is designed for specific jobs, and using the wrong tool can create more problems than it solves.
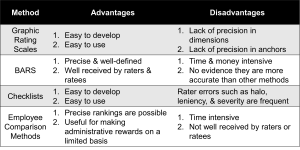
Graphic Rating Scales
Graphic rating scales represent the most commonly encountered appraisal format, requiring raters to evaluate traits or behaviors based on possession levels or performance relative to expectations. These scales, also known as Likert scales in other psychological contexts, resemble familiar rating systems from Uber drivers to Amazon product reviews.
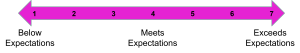
You’ve probably seen these everywhere: “Rate your driver from 1-5 stars” or “How satisfied were you with your meal?” They’re popular because they seem simple and straightforward. The format typically presents items like “Communication skills: Poor (1) – Fair (2) – Good (3) – Very Good (4) – Excellent (5).” These scales offer simplicity and broad applicability while assuming underlying qualities exist on continuums.
Despite being the first rating scale type used for performance evaluation, graphic rating scales have received criticism for poorly defined dimensions and vague descriptions. What exactly does “good communication skills” mean? Is it the same for a salesperson and a software developer? This vagueness can lead to inconsistent ratings and frustrated employees who don’t understand why they received certain scores.
Research by Landy and Farr (1983) found no differences in rater preferences or usability between 3-point and 8-point scales. However, Bartol, Durham, and Poon (2001) discovered employee preferences for more rating options due to perceived improvement possibilities. Apparently, people like having more nuanced ways to show their awesomeness!
Checklists and Weighted Checklists
Checklists require evaluators to review numerous behavioral statements and indicate whether employees exhibit each behavior. This method is particularly susceptible to rater error due to its subjective nature, resembling a behavioral grocery list with items like “Shows up on time,” “Helps coworkers,” and “Meets deadlines.”
The appeal of checklists is their apparent objectivity—either someone does something or they don’t, right? But here’s the catch: “helps coworkers” could mean anything from occasionally answering questions to staying late to help someone meet a deadline. The interpretation is still subjective.
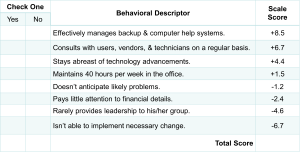
Weighted checklists assign different point values to items based on importance levels. Since behaviors vary in significance for job success, subject matter experts first rate each item using Likert scales to determine relative importance. It’s like recognizing that “meets critical deadlines” might be worth more points than “keeps a tidy workspace.”
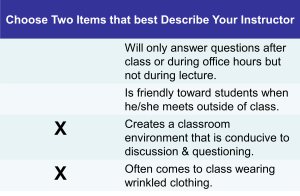
Forced-choice checklists require raters to select two items from groups of four that best describe employees. While designed to reduce bias, this approach sometimes generates negative reactions from raters who feel they’re losing evaluation control. Imagine being forced to choose between “works well under pressure” and “demonstrates creativity” when your employee does both equally well—frustrating, right?
Behaviorally Anchored Rating Scales (BARS)
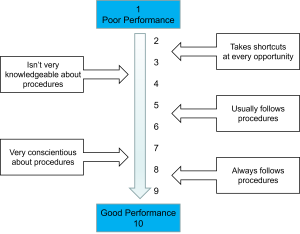
Behaviorally Anchored Rating Scales represent sophisticated rating systems incorporating specific behavioral examples describing actual or expected performance in particular job areas. Rather than generic “communication skills,” BARS provides specific examples like “Clearly explains complex procedures to new employees” or “Interrupts others during meetings.”
BARS development involves five steps: subject matter experts identify important performance areas, a second group generates behavioral examples across performance levels, critical incidents are sorted into appropriate dimensions, behavioral examples receive effectiveness ratings, and finally, the best items with clear behavioral anchors are selected.
This process is like creating a detailed recipe instead of just saying “cook until done.” BARS strengths include job-specificity and behavioral focus, though they require substantial time and financial investment. The elaborate development process ensures measurement relevance but may limit applicability across different positions.
Think of BARS as the custom-tailored suit of performance appraisal—expensive and time-consuming to create, but perfectly fitted to the specific job requirements.
Behavioral Observation Scales (BOS)
Behavioral Observation Scales ask evaluators to consider frequency of specific behaviors rather than making global performance judgments. This format provides concrete developmental feedback by focusing on behavioral frequency rather than overall assessments.
BOS approaches rate demonstration frequency of critical behaviors over specified time periods, typically using five-point frequency scales. Instead of “How good is their teamwork?” the format asks “How often do they volunteer to help colleagues with projects?” It’s the difference between asking “Are they a good driver?” versus “How often do they use turn signals?”

This approach gives employees specific, actionable feedback. Instead of hearing “you need to improve your teamwork,” they might learn “you only volunteered to help colleagues twice this quarter, while high performers typically volunteer 8-10 times.”
Employee Comparison Procedures
Sometimes organizations prefer ranking employees against each other rather than against established standards. Employee comparison procedures include rank-ordering, paired comparison, and forced distribution methods.
Rank-ordering involves arranging employees from best to worst, often used during layoff situations where lowest-scoring workers face termination. This method becomes challenging when comparing individuals in completely different positions. How do you rank a software engineer against a marketing specialist? It’s like trying to determine whether a fish or a bird is better at their job.
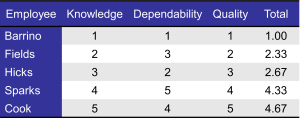
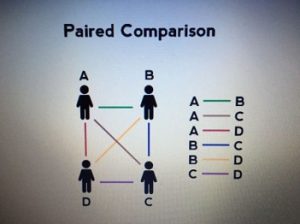
Paired comparison requires comparing each employee to every other employee across multiple dimensions, with scores calculated by selection frequency. This method becomes cumbersome as group size increases—with just 10 employees, 45 different comparisons are necessary. Imagine if March Madness had to compare every possible team pairing instead of using brackets!
Forced distribution, used by approximately 20% of Fortune 500 companies, requires distributing employees into 5-7 categories following normal distribution patterns. This approach utilizes statistical properties but can create legal issues when disproportionate numbers from underrepresented groups appear in lower categories. It also assumes that performance naturally follows a bell curve, which may not always be true for high-performing teams.
Contemporary Trends in Rating Formats
New trends include increased use of written comments, with research showing supervisor and subordinate comments are clearer than peer comments. Feedforward Interviews (FFIs) represent another innovation, focusing on employee strengths rather than weaknesses while improving evaluator-employee relationships.
The shift toward more narrative feedback reflects recognition that numbers alone don’t tell the whole story. Sometimes the most valuable insights come from thoughtful written observations that capture nuances that rating scales miss.
Media Attributions
- Exceptional Rating © DoDea is licensed under a CC BY-SA (Attribution ShareAlike) license
- Graphic Rating Scales © Jay Brown
- Weighted Checklist © Jay Brown
- Forced-Choice Checklist © Jay Brown
- Behaviorally Anchored Rating Scales © Jay Brown
- Behavioral Observation Scale
- Rank Ordering
- Paired Comparisons © Anagha Dhomne
- Comparing Rating Formats